Bring data in
You have data — a file, a spreadsheet, a Google Sheet, a warehouse. This guide shows each way to get it onto a dashboard, and how to keep it fresh.
Whatever the way in, the result is the same: a datasource — a named set of rows saved into the dashboard. Charts and tables read those saved rows. Viewers read them too, and never touch your file, your sheet, or your accounts.
Drop a file on the canvas
The fastest path. arkush reads CSV, Excel, JSON, and Parquet files.
- Open your dashboard in Edit mode.
- Drop the file anywhere on the canvas.
That is the whole import. The file becomes a datasource, and a table bound to it lands where you dropped the file. A notice states the file name and the row count. One undo removes both. On an empty dashboard the same import is the first step of the Start your dashboard walk: Upload a file opens the file picker.
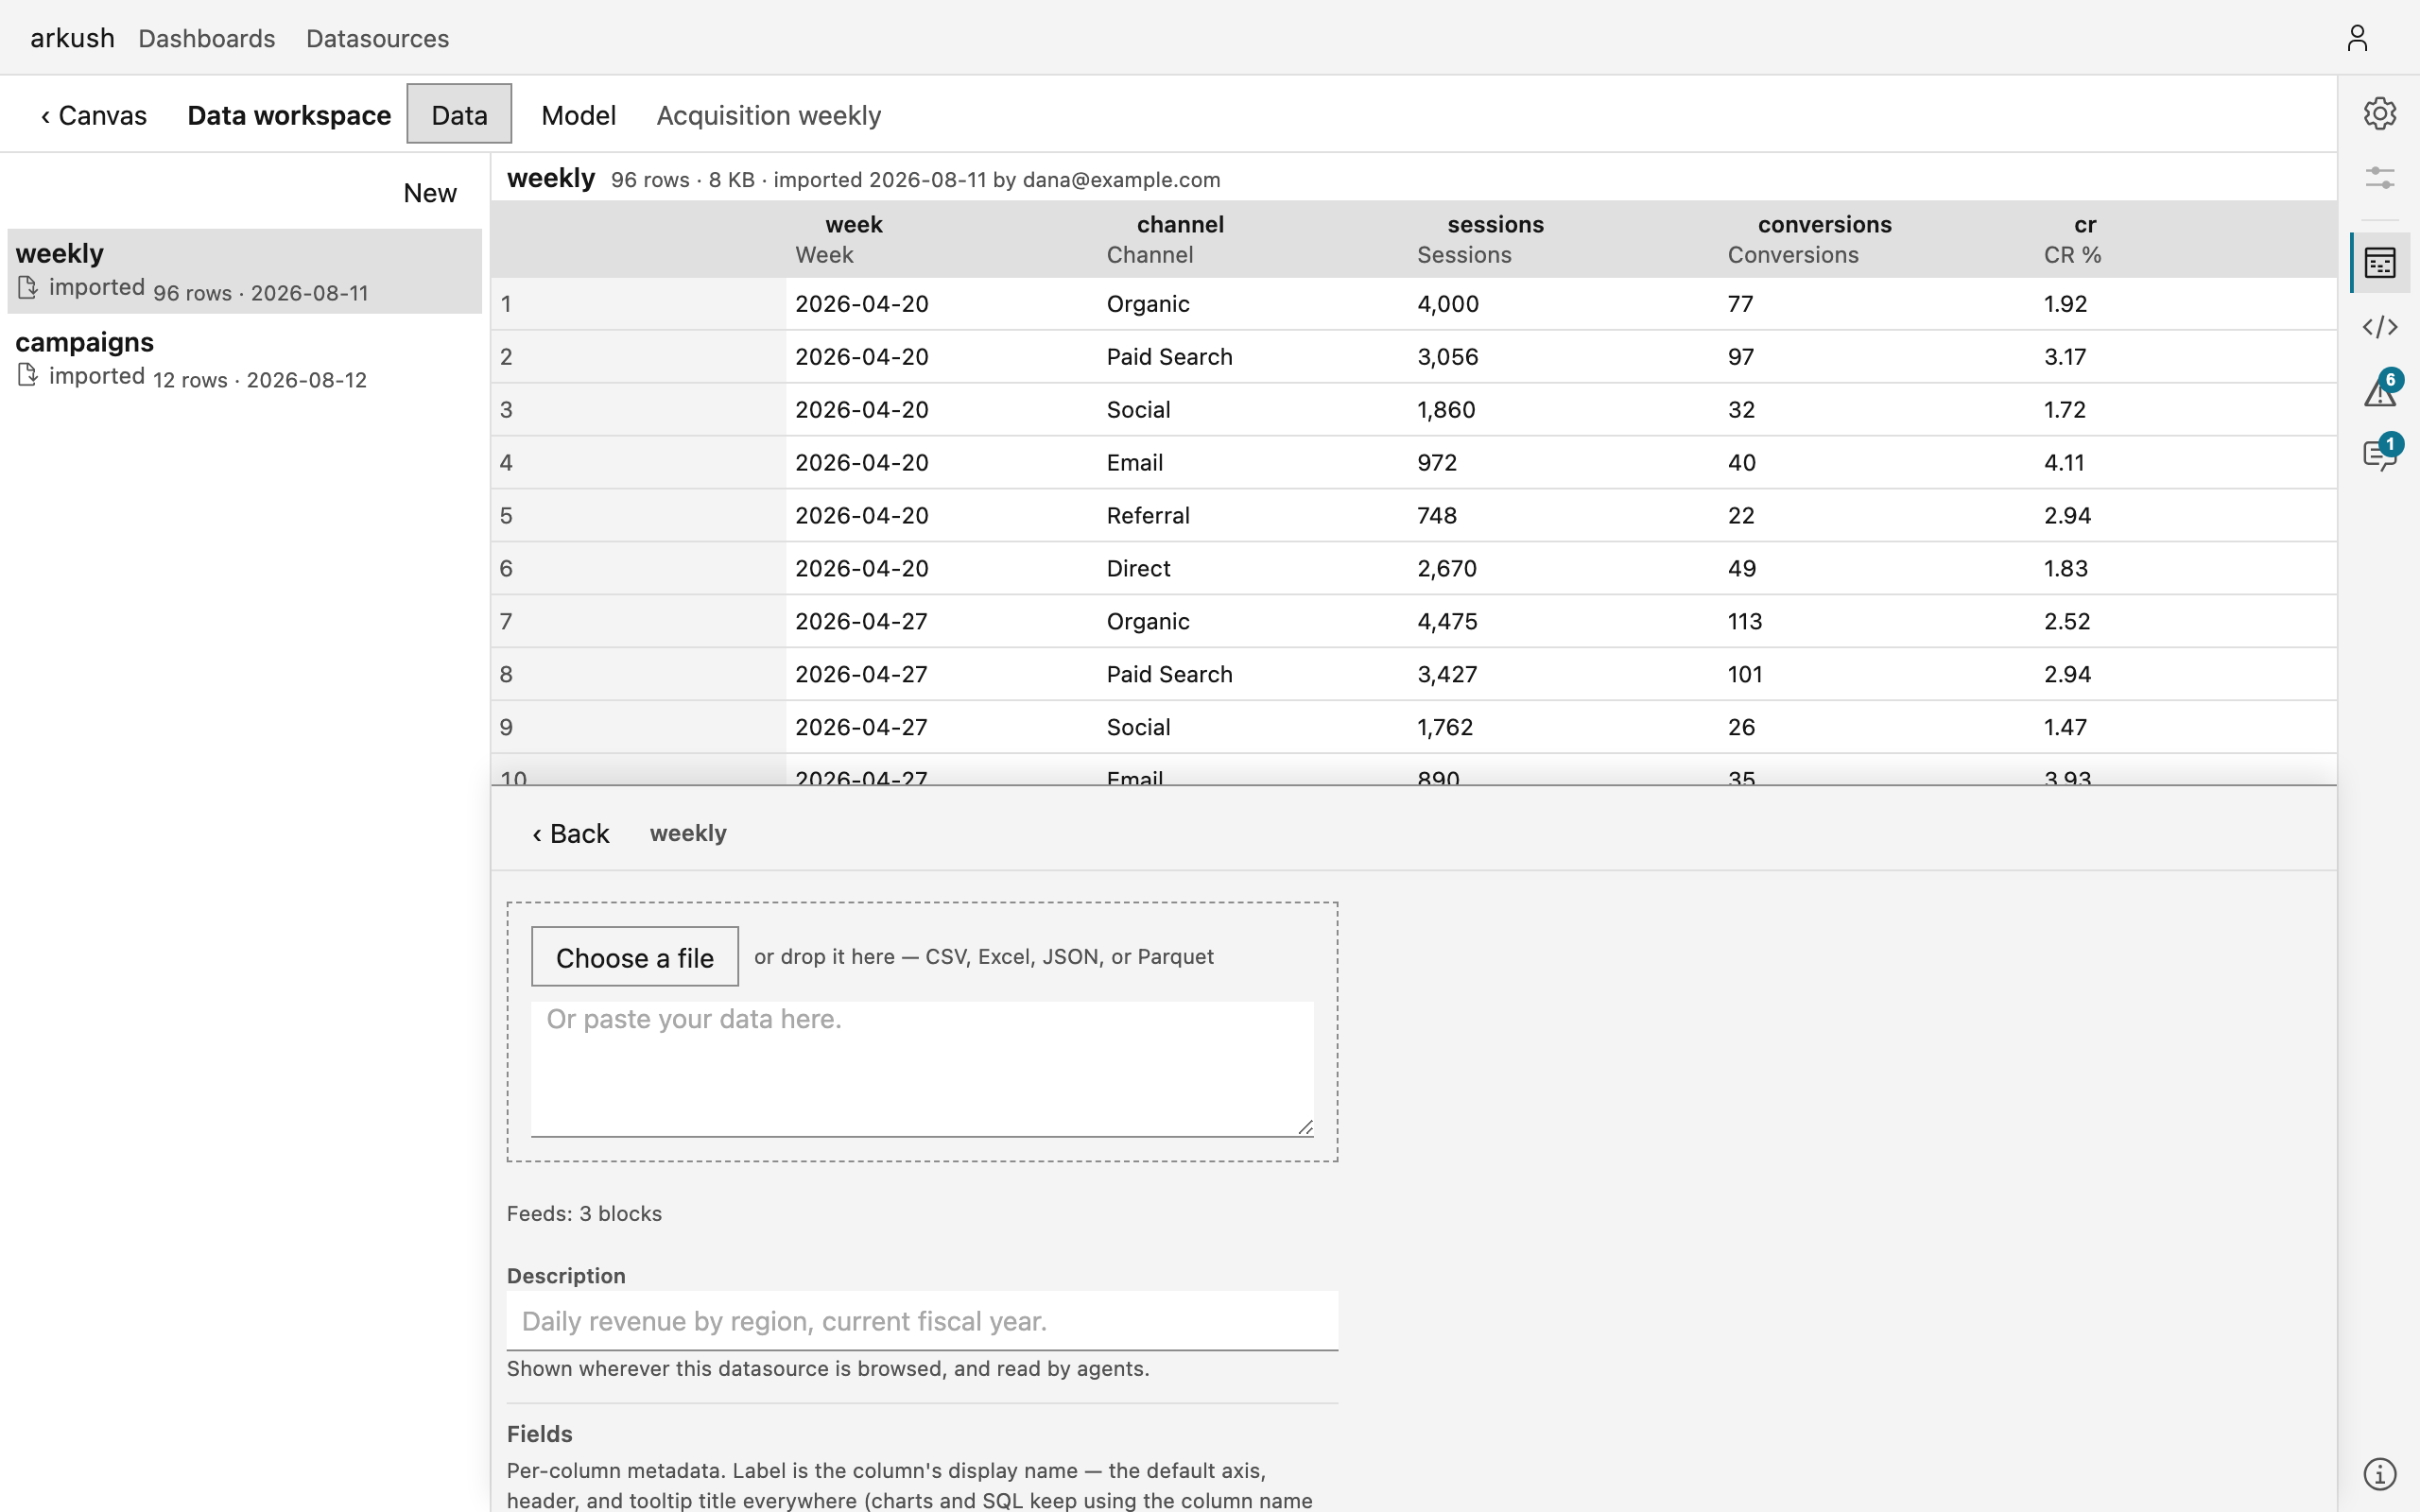
An Excel workbook with one sheet imports the same way. A workbook with several sheets opens the import editor with a Sheet picker instead — the app never guesses which sheet you meant. Pick the sheet, then select Create datasource.
When the file has more than 50,000 rows
A large file is not refused. The import editor opens with the file already read and the true row count shown. Rows over the 50,000 limit cannot be stored as-is, so a SQL editor stands ready over the file — the query's result becomes the datasource.
- Keep the starter query for a quick cut — it keeps the first 50,000 rows. Or aggregate for the full picture: the Insert a transform picker offers starters built on your own columns — group and count, count by month, top 10, and more.
- Select Run query and check the preview.
- Select Create datasource.
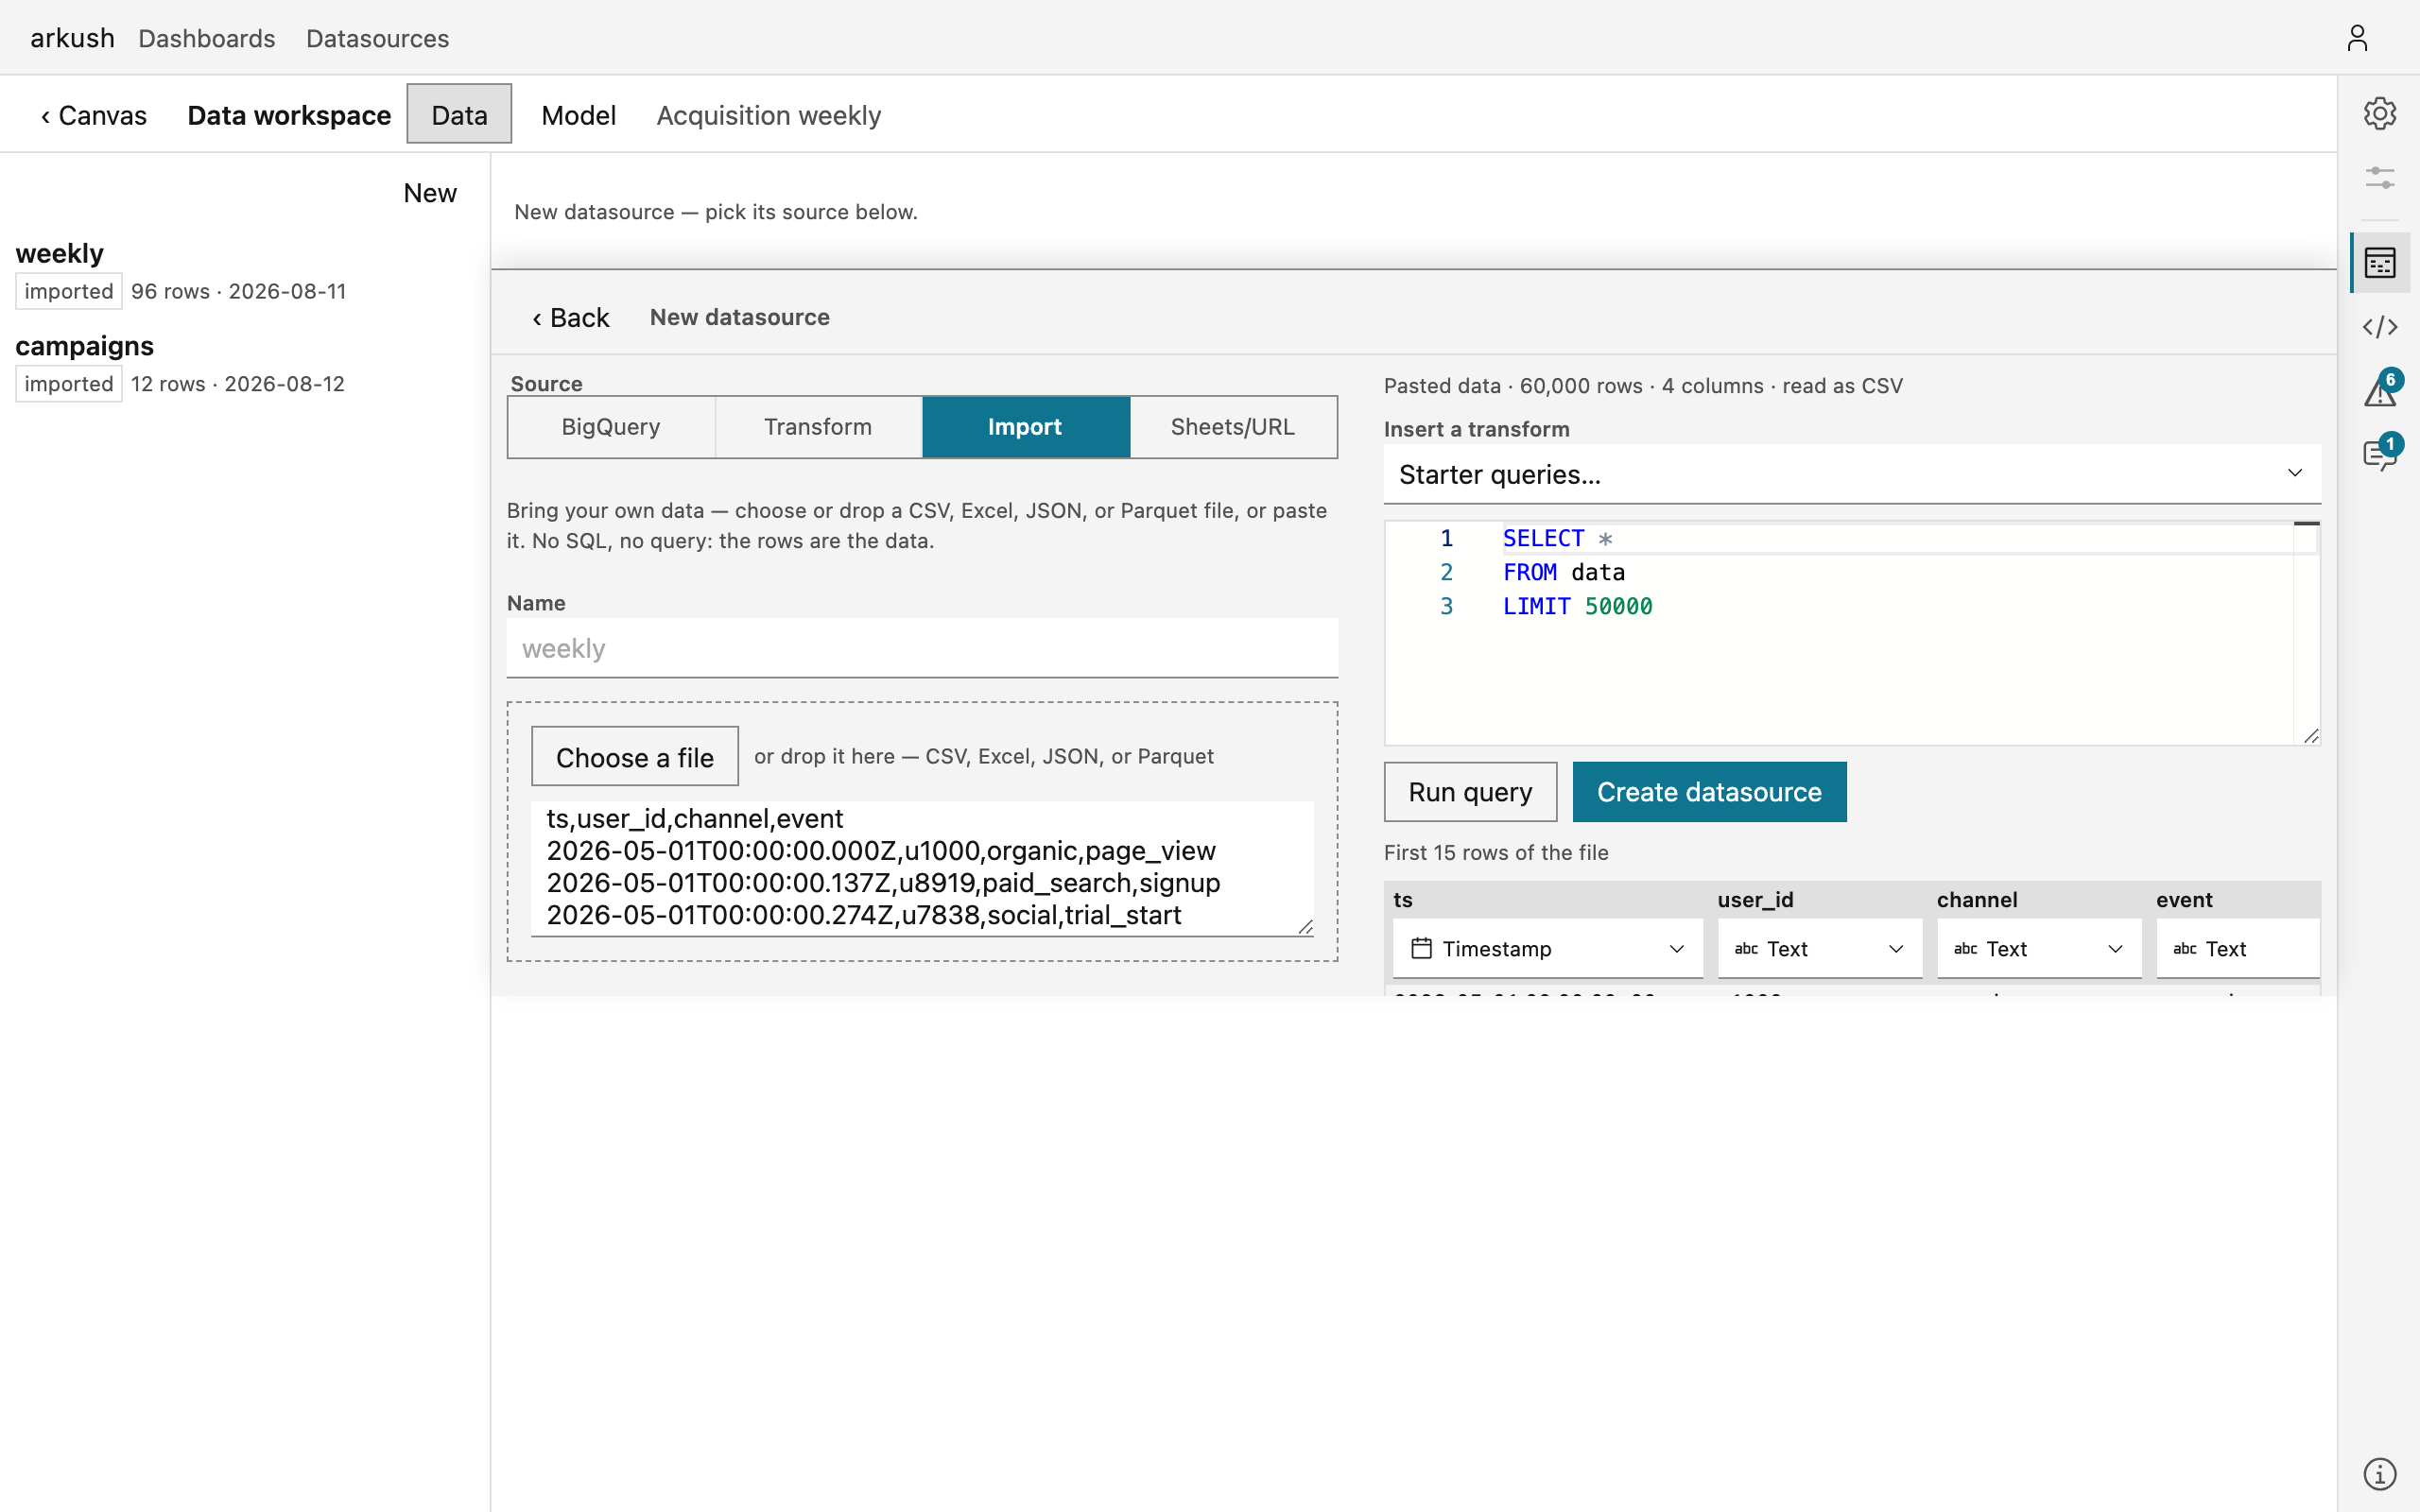
Paste rows from a spreadsheet
Copied cells paste straight in — no file needed.
- Copy the rows in Excel or Google Sheets.
- Open the Data panel — the Data icon on the right-hand rail.
- Select New. The Data workspace opens, with the editor under the data grid.
- Select Import as the source.
- Paste into the Or paste your data here. box.
- Check the facts line: the row count, the columns, and how the text was read.
- Select Create datasource.
The preview shows each column's type under its name. If a column read wrong — a date read as text, for example — pick the right type there. A value that will not convert is marked before you commit, struck through with the reason — never a silent blank after.
The new datasource is ready for a chart or a table — add one from the block palette in the header.
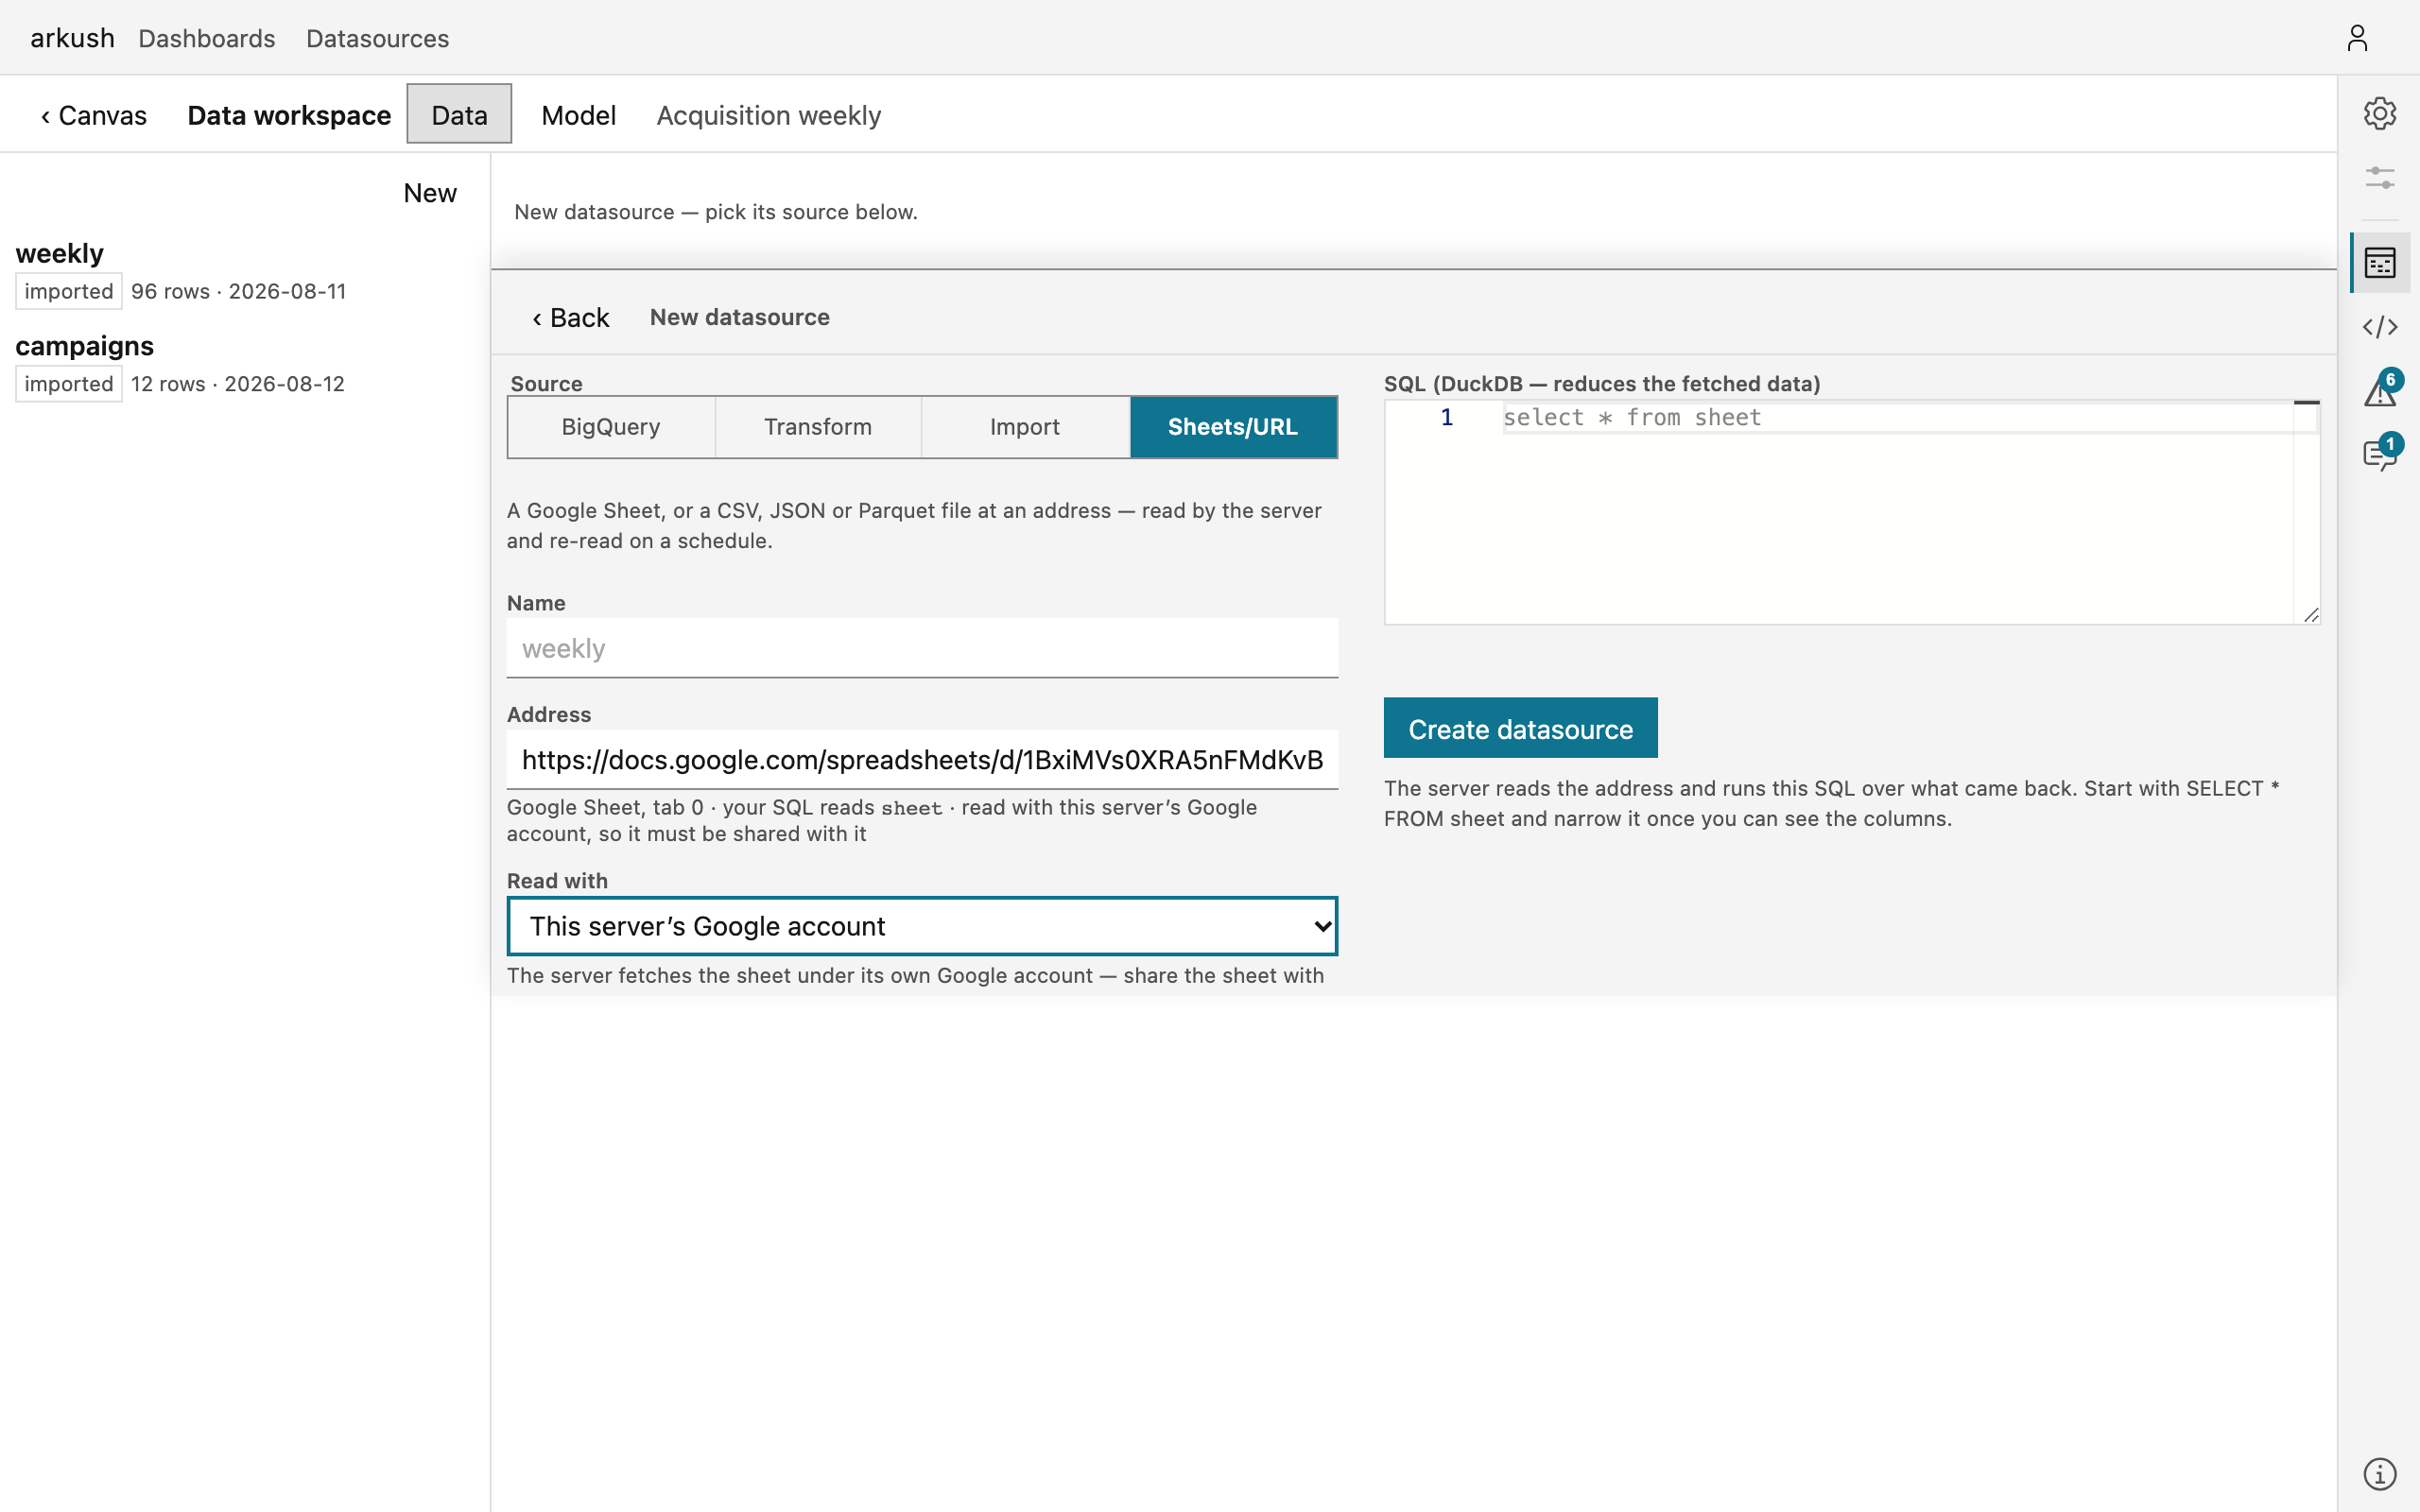
Connect a Google Sheet or a file at an address
Data that lives at an address — a Google Sheet, or a CSV, JSON, or Parquet file on the web or in cloud storage — can refresh itself on a schedule.
- Open the Data panel and select New.
- Select Sheets/URL as the source.
- Paste the address. The field states what was recognized: the source, the sheet tab, and the table name your SQL reads. For a sheet, copy the link while the tab you want is open — the link carries the tab.
-
Write the SQL. Start with
SELECT * FROM sheetand narrow it once you see the columns. - Select Create datasource.
Who can read what:
- A published CSV, or a published sheet, needs no credential. The server fetches it, and the refresh schedule can keep it fresh.
- A private Google Sheet has two paths. Share the sheet with this server's Google account, and the server reads it — schedule included. Or set Read with to Your own Google account: your browser reads the sheet under your own sign-in, so a sheet only you can see works. The first read of each sheet opens a Google window with that sheet already shown — select it once, and the app gets access to that one file only. That path refreshes only when an editor selects Refresh — the schedule never runs it.
- The deployment sets the reach. The server fetches only from addresses an administrator allowed — a refused run names the host to ask about. A source read with the server's own Google credential also needs the analyst right.
Query BigQuery with your own account
Write SQL against the warehouse and save the result. The query runs as you.
- Open the Data panel and select New.
- Select BigQuery as the source.
- Write the SQL, or select a table in the table browser for a starter query.
- Select Run in BigQuery. You do not need to connect first: the first run asks for Google sign-in, with read-only access to BigQuery and nothing more.
- Check the preview, then select Create datasource.
The connection row above the SQL shows which Google account the queries run as, with explicit Connect and Disconnect. Queries bill to a billing project — the deployment sets a default, and the same row lets you pick another.
NOTE — Your Google sign-in stays on your machine. It is never written into the dashboard, and it is never sent to the server.
BigQuery under the org's own credential — the kind a schedule or an agent refreshes server-side — needs the analyst right.
Store a file for reuse
An import copies rows into one dashboard. The files store keeps the original file: several dashboards can read it, and a replacement reaches all of them. The store needs a signed-in account, and it holds CSV, JSON, and Parquet files.
- Upload from the Datasources page. Select the arkush brand at the top left, then the Datasources tab. The Uploaded files section closes the page — select Upload file.
- Or keep the original while you import. Within the limits, turn on Keep the original file in Uploaded files. Over the row limit, the reduce flow stores the original as part of the flow.
A datasource built on a stored file keeps its reduction SQL. Refresh re-runs that SQL over the file's current bytes, on the server. When someone replaces the file — Replace file, on the file's own page — every dashboard that reads it shows File changed until its next refresh.
A file is private to you until you share it from its page. Refresh needs access to the file itself, not only to the dashboard. A deployment may set a per-person space limit: the section shows your usage, and at the limit uploads refuse until you delete a file.
Keep the data fresh
Charts read saved rows, so fresh numbers come from a refresh — never from opening the dashboard.
- One datasource: select Refresh beside it in the Data panel. The stored query runs again, and the new rows replace the old.
- Everything at once: with several query datasources, Refresh all heads the list. It re-runs each in turn, and one failure never stops the rest — the report names each failed datasource.
- Imported rows have no query. To swap them, open the datasource and select Replace data.
- On a schedule: in the Data panel's Scheduled refresh section, select Schedule…, then set the cadence (a cron expression) and a timezone. The next run shows before you save. The schedule repeats only queries a person or an authorized agent already ran: after you change a query, run it once, and the schedule takes over. A query under your own Google sign-in runs only in your browser — the schedule never runs it.
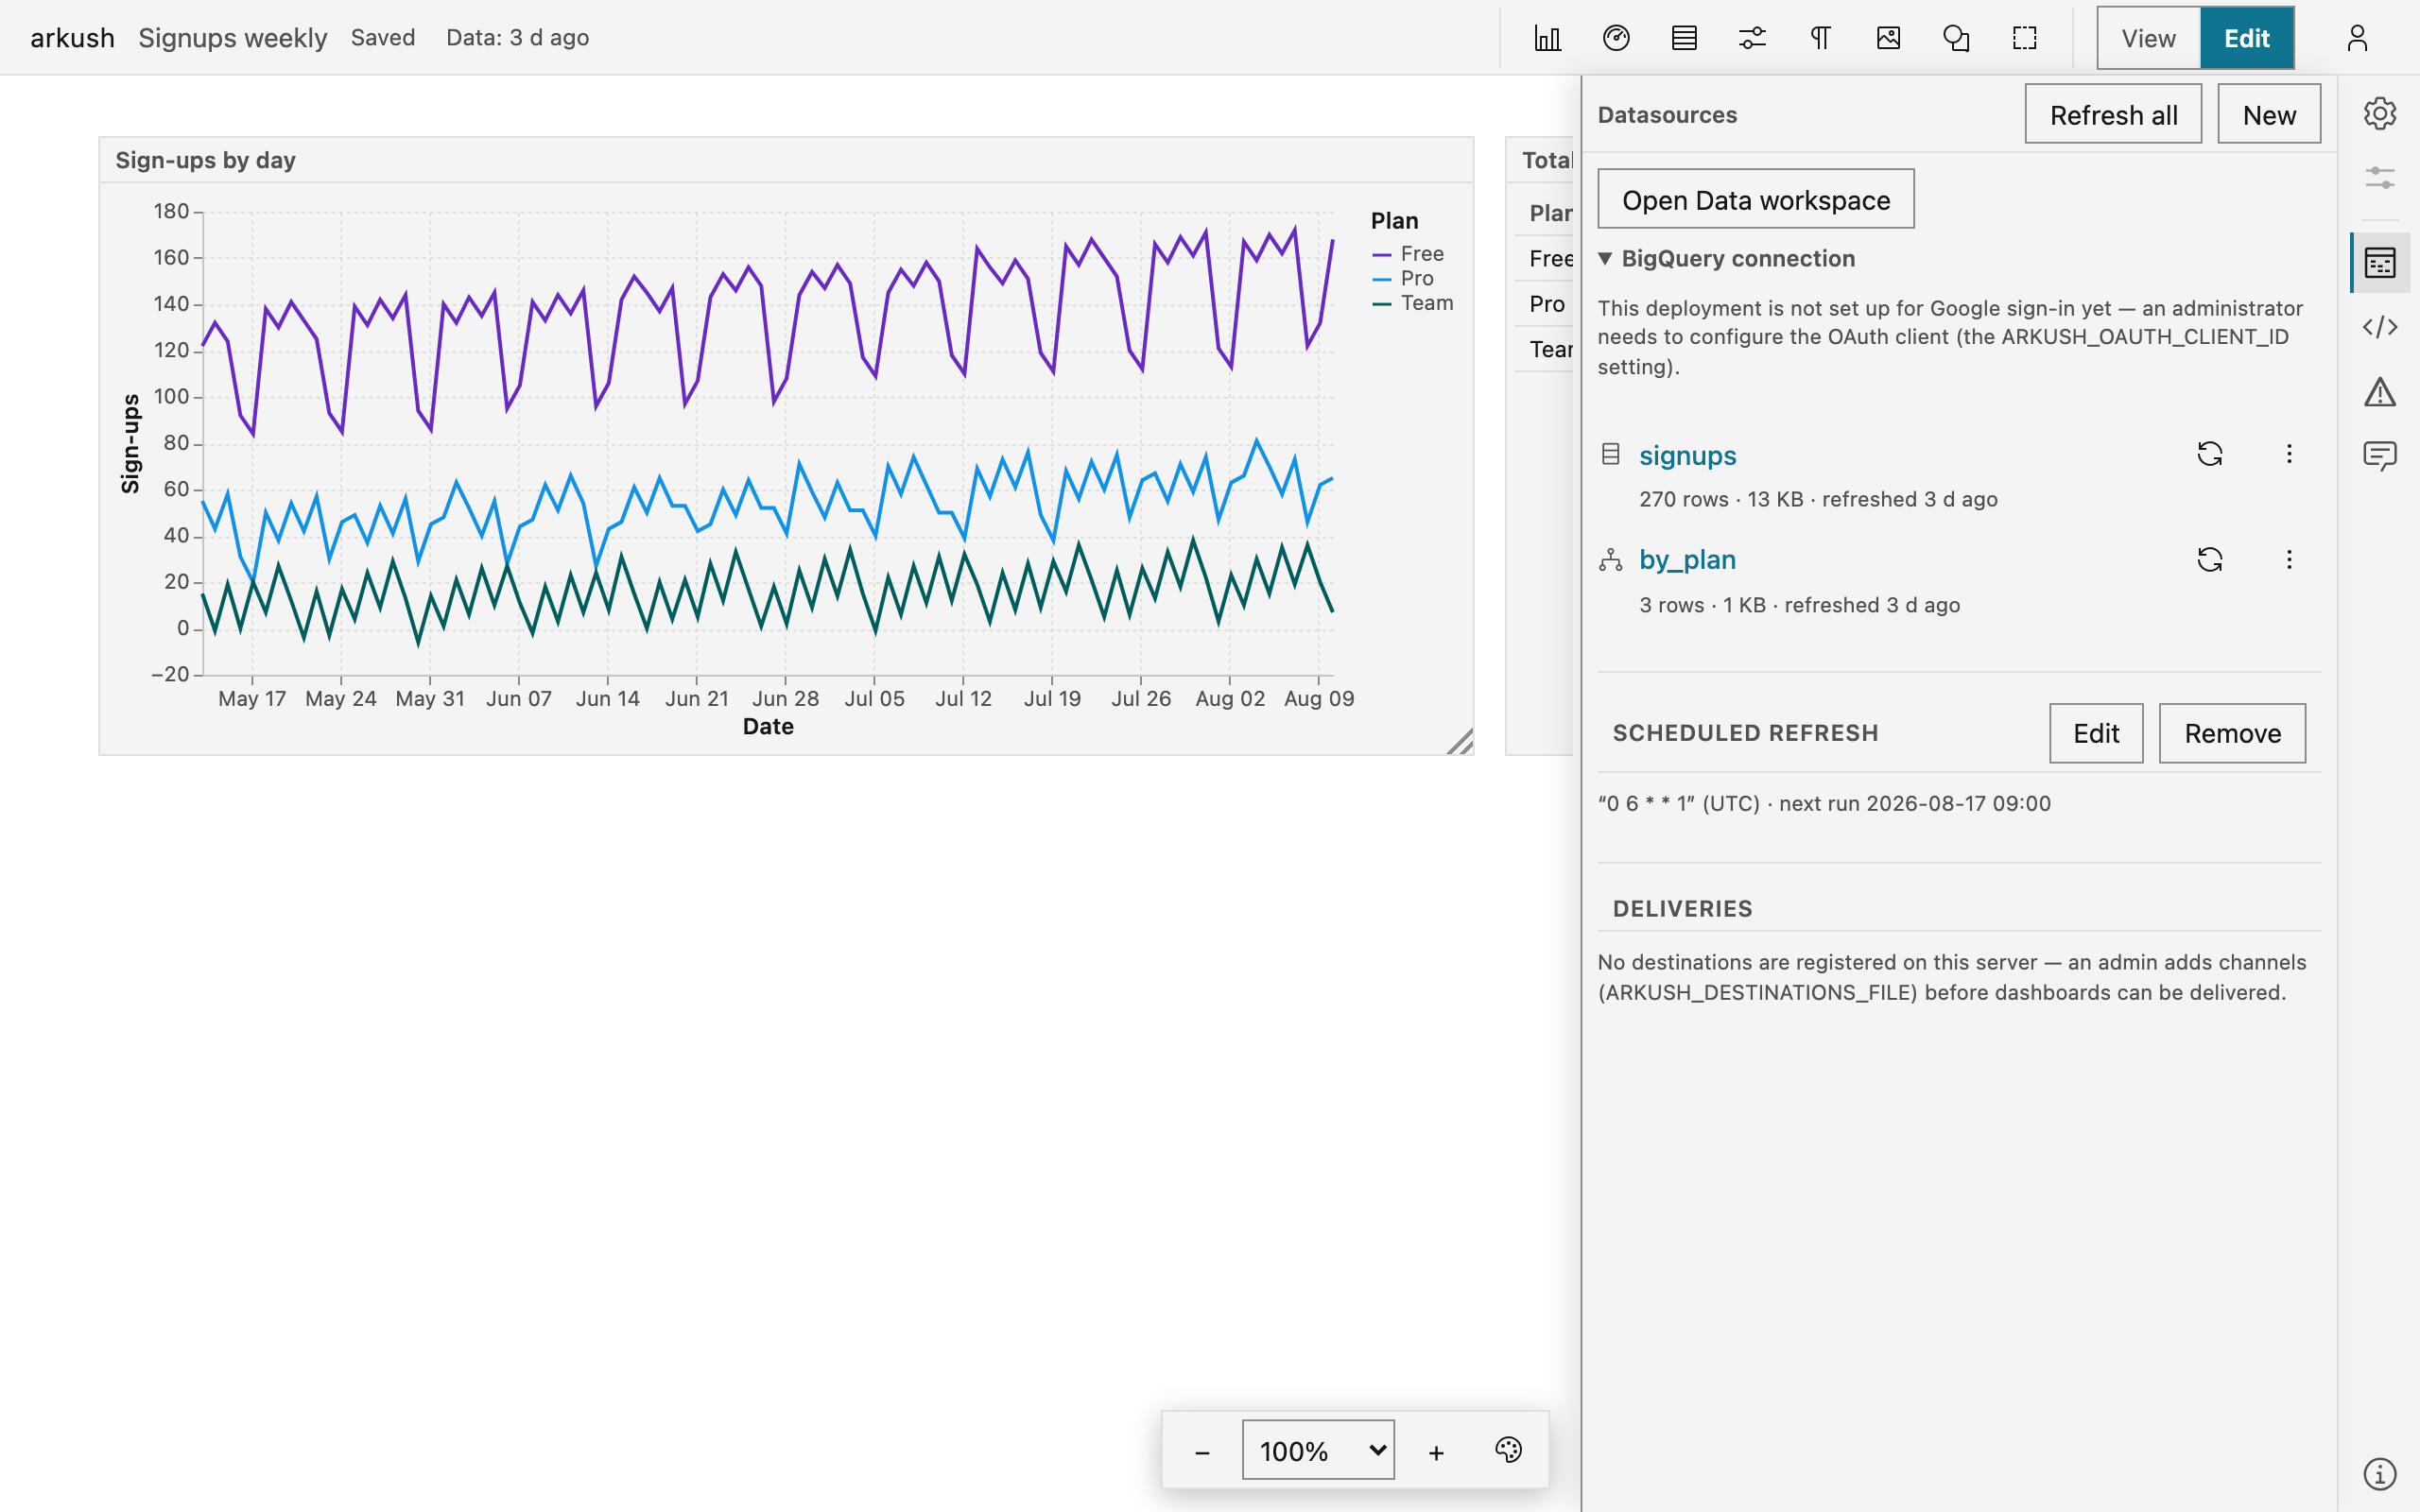
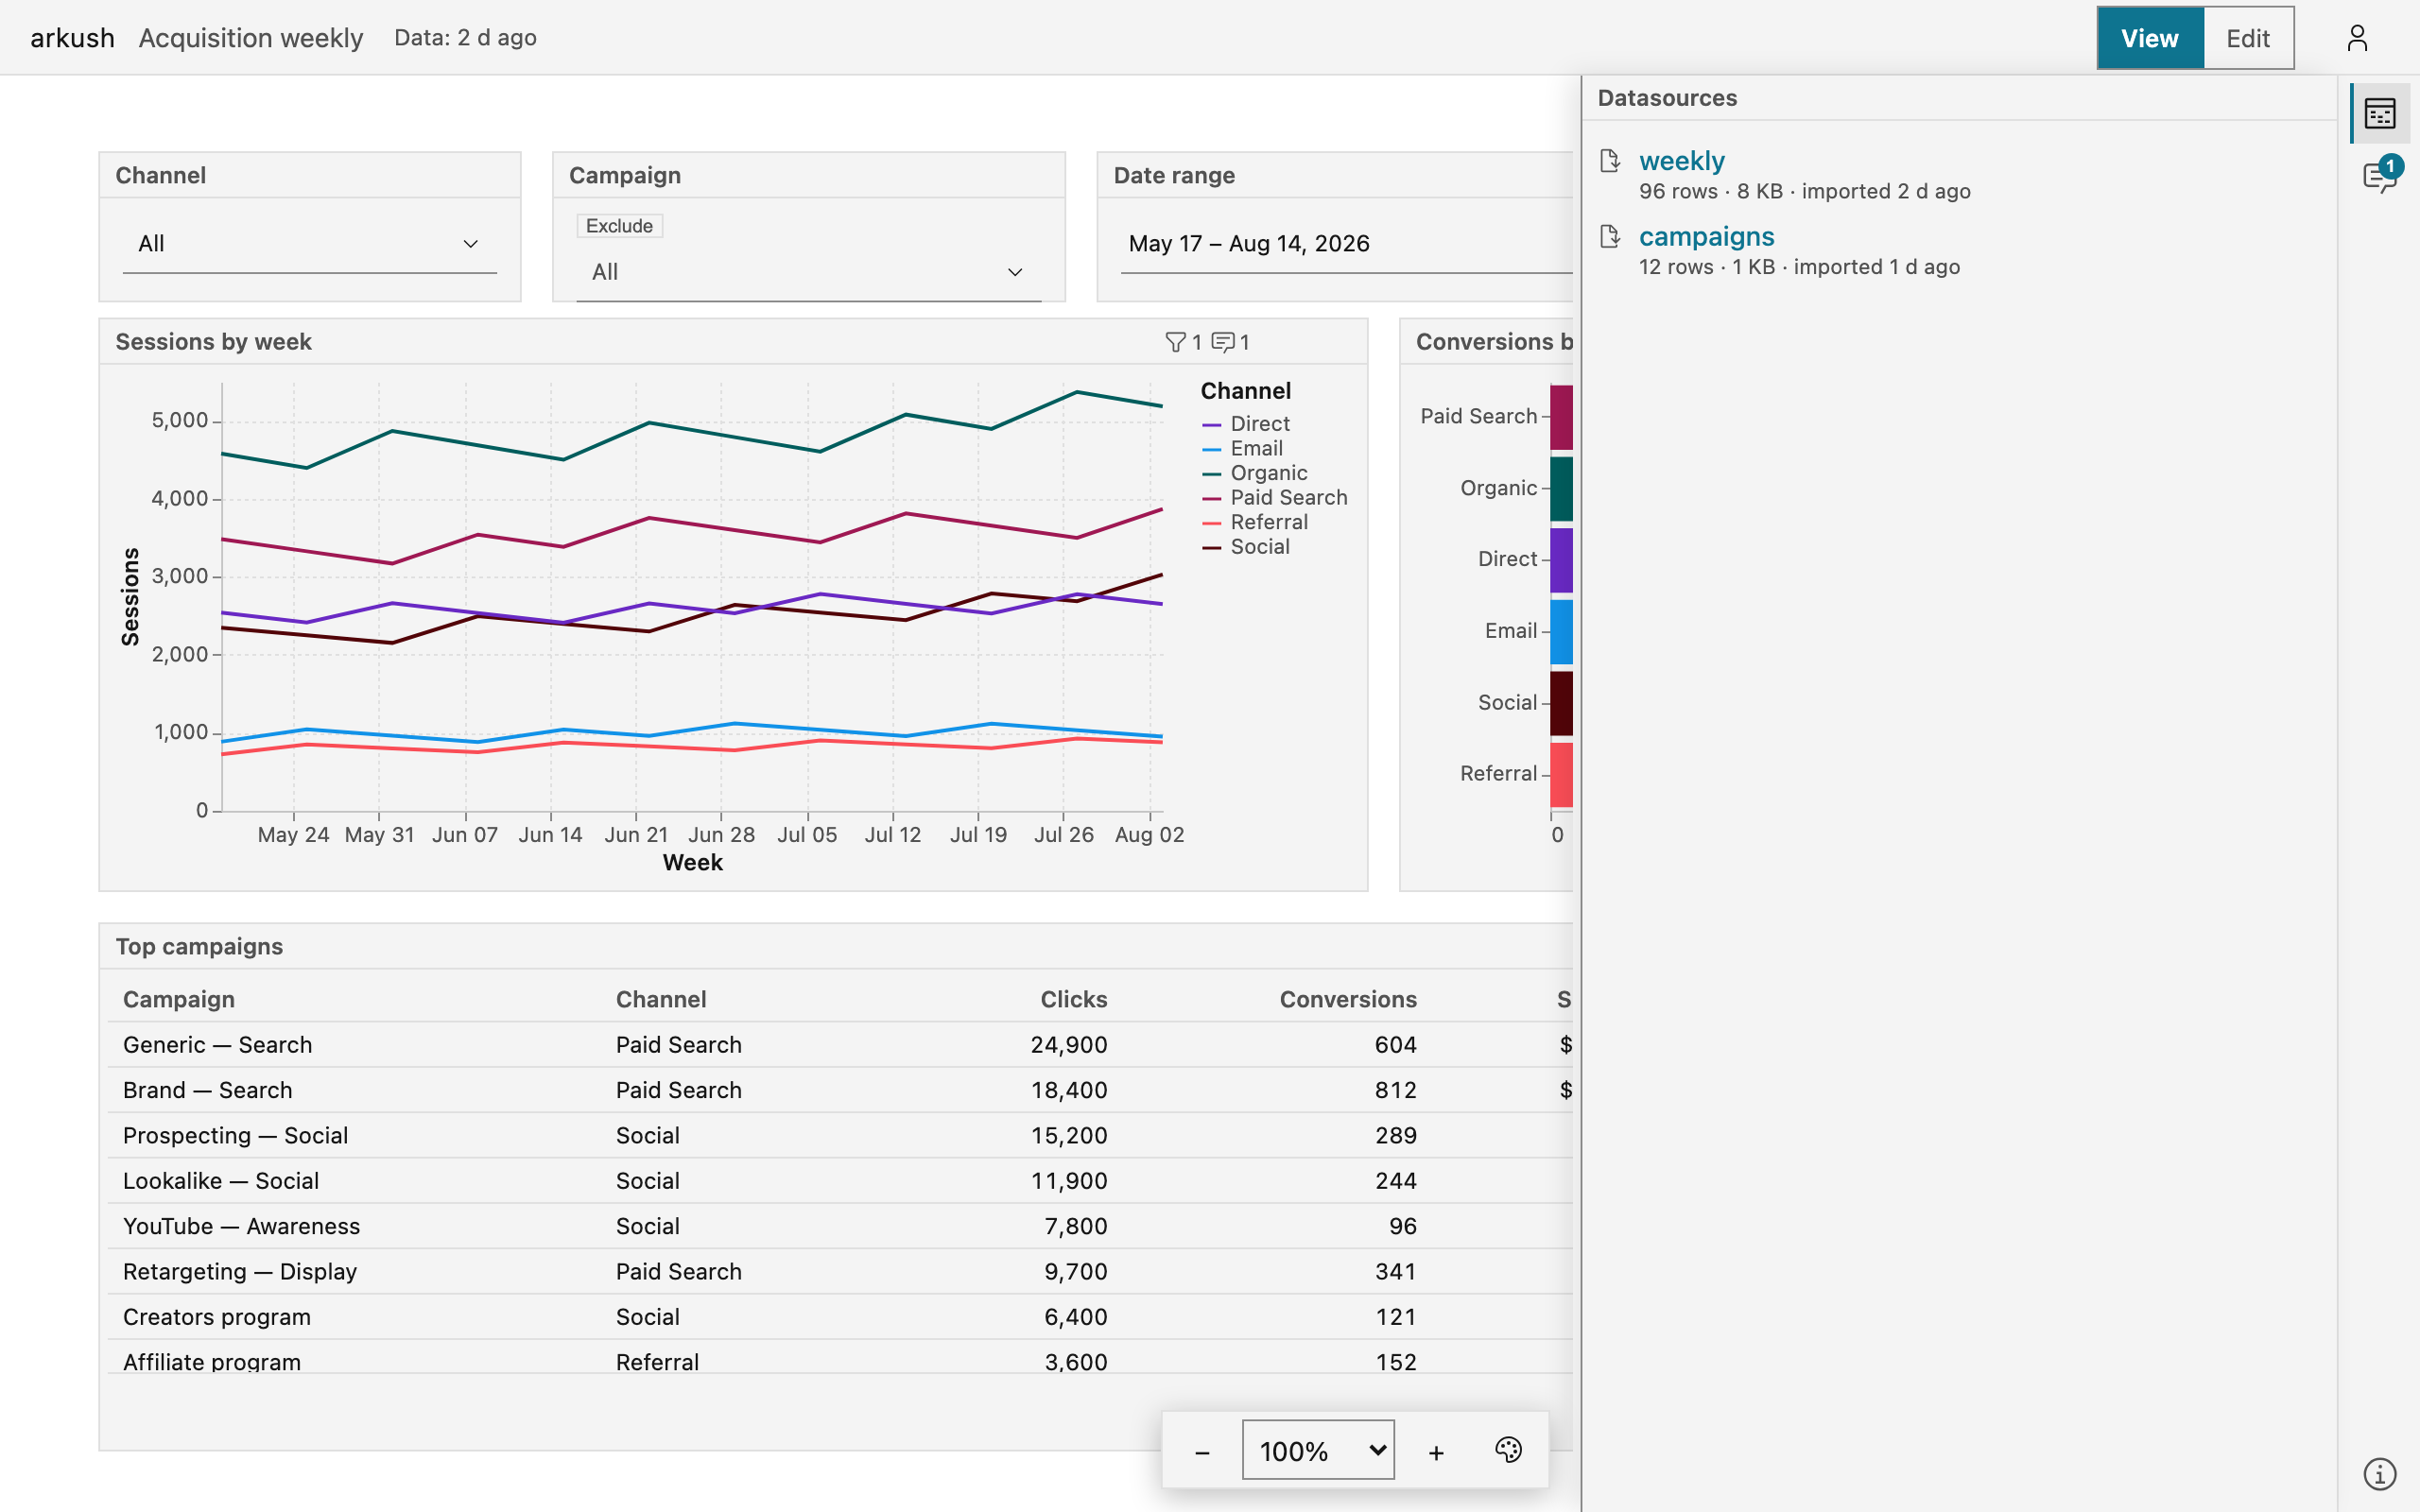
The header shows a freshness chip — "Data: 2 h ago" — with the age of the oldest saved data, for editors and viewers alike. Select the chip to open the Data panel. With a schedule set, the chip turns amber when a run is overdue.
The limits
Every limit has the same remedy: make the data smaller.
- 50,000 rows per datasource. A BigQuery run over the cap previews fine and says so — Save would keep only the first rows. An imported file over the cap goes to the reduce flow. Either way, aggregate or filter so the whole result fits.
- One size budget per dashboard. All saved rows share 32 MiB. A save over the budget is refused, with the total named. Reduce in SQL, or clear another datasource's snapshot — Clear snapshot in its row menu drops the data and keeps the query.
- 512 MB per imported file, checked before anything is read.
The limits are what keeps a dashboard fast to open and safe to share: every viewer reads saved rows, never a live query.